Introduction: Framing the long crisis
For many Americans, the first years of the Trump presidency have brought into focus some of the large-scale challenges facing the country: the early onset of climate change (and intensifying natural disasters such as fires, floods, and hurricanes), enduring legacies of structural racism and white supremacy, endemic violence (including, particularly, against women) and mass murders, the deliberate degradation of democratic institutions and norms (from both monied interests and internal and external actors), and increasing economic inequality and uneven economic development, to name but a few. Americans are responding with what appears to be increasing political engagement and activity—from the massive women’s marches in the early days of the Trump administration to the record high voter turnout levels in the 2018 midterm elections.
While it is tempting to blame Donald Trump, and the virulent form of right-wing extremism he represents, for the nation’s ills, this is, unfortunately, an inadequate reading of our recent history—and a dangerous one at that. In many ways, the rise of Trump is actually a symptom of a much longer systemic crisis that has been building over the last several decades. This first-ever edition of The Next System Project’s Index of Systemic Trends is an effort to begin to quantify, track, and visualize this crisis.
One of the signs that a crisis is systemic, rather than purely political or economic, is that key indicators decline or stay the same regardless of changes in political power or business cycles. Since 1970, the United States has experienced six party changes in the White House, five party changes in control of the Senate, and four in the House of Representatives. It has also experienced seven recessions (and recoveries). Yet, as this index attempts to demonstrate, on many very important indicators of economic, social, and democratic health there has been little improvement and, in many cases, substantial deterioration over this period. The trends considered in this section include poverty, wealth inequality, racial wealth inequality, income inequality, wage stagnation, the cost of higher education (and student loan debt), homeownership (and racial inequality), corporate taxation, taxation of the rich, union density, incarceration rates (including by race), labor force participation rates, healthcare costs, climate change, and life expectancy.
Another way to evaluate whether or not a political-economic system is in crisis is to compare its outcomes against similar systems. During much of the second half of the 20th century, the myth of “American Exceptionalism”—that, essentially, America was the greatest country on the planet—gained widespread acceptance in many segments of society. This myth was always constructed on weak foundations (a heavy reliance on the projection of military and economic power internationally and a deliberate ignoring of massive racial oppression domestically) and is increasingly coming under scrutiny from people of all political persuasions. (The Donald Trump mantra of “Make America Great Again” is an illustration inasmuch as it implies that America is no longer great, or exceptional). This index attempts to show that, far from being exceptional, the United States’ political-economic system actually compares relatively poorly with other advanced systems across various important indicators. US performance on these indicators is compared against the 35 other OECD countries, including both advanced contemporaries (including the United Kingdom, Japan, and Germany) as well as less developed countries (such as Turkey, Mexico, and Hungary). Indicators presented here include poverty (as well as child and elderly poverty), inequality, union membership, women in politics, healthcare spending, life expectancy, infant mortality, maternal mortality, homicide, violence against women, weapons exports, prison population, and greenhouse gas emissions.
This index is by no means a comprehensive or empirical study. It is designed purely to be illustrative of what, we believe, is an important observation: that our current political-economic system is consistently failing to deliver improvement and or competitive results compared to other advanced economies across a variety of different measures; and that this is indicative of a systemic crisis and the need to move in the direction of a new system that can and will produce better outcomes. In future editions, we hope to both update the trends and comparisons, as well as add new ones that may provide a broader picture. We also intend to include potential positive trends in the direction towards a new system (for instance, the rise in employee ownership). The data in this index is drawn from a variety of government and NGO databases. In all cases, efforts were made to attain the most up-to-date information. However, in some cases (especially for the country comparisons) the latest available data may be from different years. We would like to acknowledge and thank researchers Cecilia Gingerich and Jarrid Green who compiled and analyzed much of the data in this edition of the index.
An unequal economy
Poverty
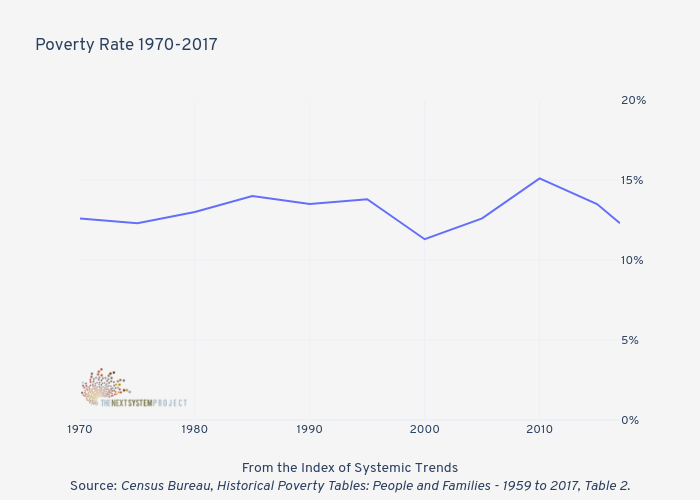
In 1964, President Lyndon B. Johnson declared an “unconditional war on poverty in America.” Books like Michael Harrington’s The Other America had shone a spotlight on the pervasive poverty that gripped much of the supposedly richest country on Earth and spurred politicians to action. The War on Poverty, which included a raft of social insurance and economic development initiatives, experienced some initial success. The percentage of people living below the official poverty line dropped from 22.4% in 1959 to 12.1% in 1969. By 1973 it hit its lowest recorded point: 11.1%. There was considerable optimism, especially in liberal circles, that poverty would, indeed, eventually be eradicated (primarily through the extension and expansion of government programs). However, this prediction was unfounded. Since 1973, the poverty rate has remained relatively constant around 13% despite being named as a priority by most politicians from both major political parties.1
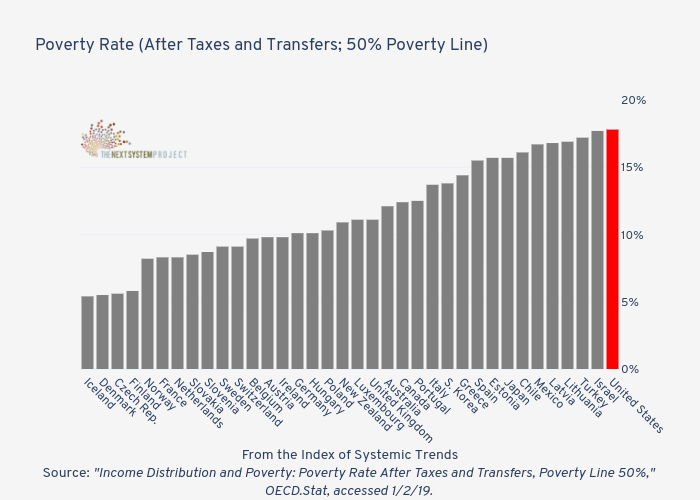
How the official U.S. poverty rate is calculated is something of a historical anomaly. Specifically, in 1963 Mollie Orshansky from the Social Security Administration calculated the poverty line at three times a subsistence food budget. The subsistence food budget, in turn, was based on a 1961 Economy Food Plan developed by the US Department of Agriculture (based on 1955 consumption statistics). Each year, this initial calculation from 1963 is adjusted for inflation via the Consumer Price Index to set the current poverty line. Needless to say, this method of calculating poverty is outdated at best, and routinely comes under criticism from both the left and the right. Around the world, a variety of other methods are used to calculate poverty. One of the more popular (and simpler ways) is to set the poverty line at 50% of median income and determine how many people fall below this after taxes and transfers (thus taking into account both a person’s tax burden and their share of social spending). When measured this way, the U.S. poverty rate of 17.8% in 2016 was significantly higher than the official rate of 12.7%. Moreover, out of the 36 OECD countries, the United States ranks dead last when poverty is measured in this way.2
Wealth inequality
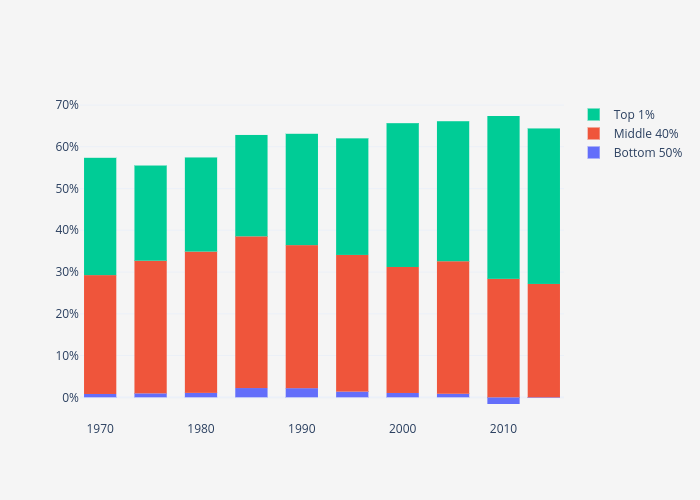
Looking at the distribution of wealth is one of the simplest ways to determine how equitable (or inequitable) a society is. Access to wealth (or lack thereof) impacts the type (and quality) of education a person receives, their employment prospects, their health and life expectancy, their political power, and more. As Thomas Piketty points on his landmark work Capital in the Twenty-First Century, increased concentrations of wealth (and particularly inherited wealth) are “potentially incompatible with the meritocratic values and principles of social justice fundamental to modern democratic societies” (p. 26). Traditionally, the younger, larger United States did not have the same levels of wealth concentration that the older European states developed. However, by 1929, on the eve of the Great Depression, the top 1 percent had amassed around 48% of the total net personal wealth in the country. Like other countries, the depression (and the New Deal), World War II, and post-war social democratic policies lessened wealth inequality and led to a thriving middle class. By 1970, the top 1 percent and the middle 40 percent of Americans had a similar share of wealth (around 28%). The bottom 50 percent of Americans, however, had virtually nothing. Since 1970, the wealth share of the top 1 percent has substantially increased, while that of the middle 40 percent has fallen. The bottom 50 percent has seen virtually no improvement, with any gains wiped out during the 2008 financial crisis. It is worth pointing out that from purely a population perspective, 1 percent of all American adults is around 2.5 million people; while 40 percent represents a little more than 100 million people; and 50 percent represents 126 million people.3
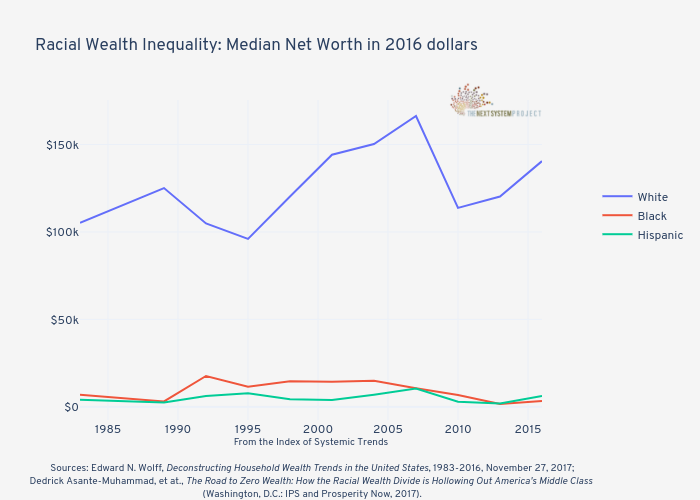
Racial wealth inequality
Trends around wealth inequality are even more pronounced when looking at race. In 1983, Black and Hispanic households had just $7,000 and $4,100 respectively in median net worth. Comparatively, the median net worth of White households was around 1,500% higher, at $105,300. While the wealth of all groups fluctuated over the next 30 years, the gap remained relatively consistent. Moreover, by 2016, the median net worth of Black families had fallen to roughly half that of 1983 levels and the median net worth of White families had increased to 4,000% higher. In a landmark 2017 report, the Institute for Policy Studies and Prosperity Now found that by 2024, Black and Hispanic families will own 60-80% less wealth than they did in 1983. Moreover, “if the racial wealth divide is left unaddressed and is not exacerbated further over the next eight years, median Black household wealth is on a path to hit zero by 2053—about 10 years after it is projected that racial minorities will comprise the majority of the nation’s population. Median Hispanic household wealth is projected to hit zero 20 years later, or by 2073. In sharp contrast, median White household wealth would climb to $137,000 by 2053 and $147,000 by 2073.”4
Income inequality
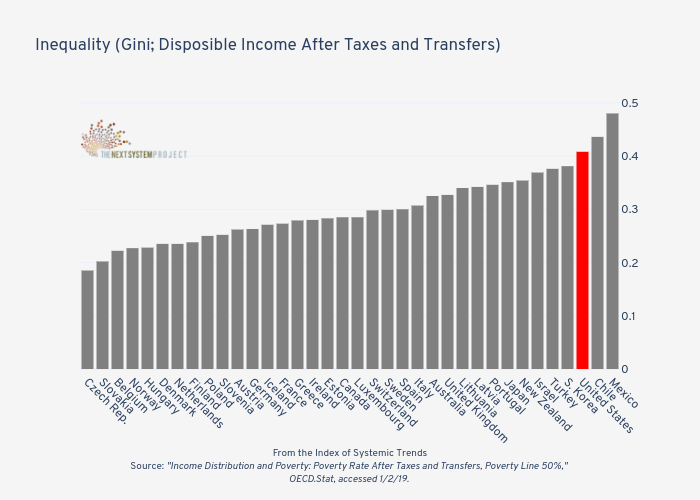
A second important indicator of economic inequality is income share. As Piketty points out, wealth and income inequality are related and it is “the interaction between the two that’s important.” High levels of income inequality are associated with a host of negative effects, such as low social mobility, low economic growth, poor mental health, and more. As with wealth, income inequality fell precipitously during and after the Depression and World War II period, with the top 1 percent’s share of pre-tax national income reaching a low of 10.4% of pre-tax national income in 1976. Since then, it has exploded. By 1995, during the presidency of Bill Clinton, the top 1 percent and the bottom 50 percent had roughly the same share of national income (15%). Since this inflection point, the top 1 percent’s share has continued to increase, while the bottom 50 percent’s share has fallen even further. “The magnitude of the change is impressive,” Piketty writes. “It is natural to ask how far such a trend might continue.”5

The United States is one of the most economically unequal countries in the OECD. This may seem unsurprising given the trajectory of American capitalism in the past few decades. However, as Thomas Piketty points out, the relatively new United States actually started the 20th Century with less inequality than its European counterparts, which had significant accumulated (and inherited wealth) in the hands of its aristocracy. Yet, over the broad sweep of the 20th Century, inequality in the United States eventually surpassed that in European countries. “The most striking fact,” Piketty states, “is that the United States has become noticeably more inegalitarian than France (and Europe as a whole) from the turn of the twentieth century until now, even though the United States was more egalitarian at the beginning of this period.”6
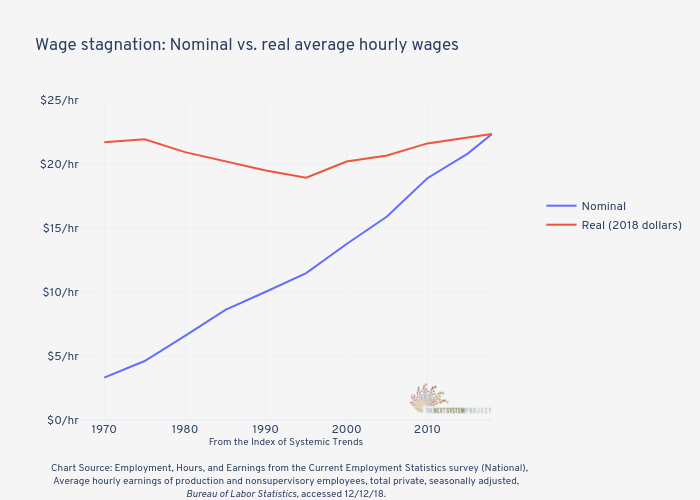
Wage stagnation
For the vast majority of Americans, wages have been stagnant for more than 40 years. For production and nonsupervisory workers in the private sector, average hourly earnings today are essentially the same as they were in 1970 when inflation is factored in. Moreover, wage gains have disproportionately gone to the highest earners. “This failure of wages to grow and rising wage inequality is the primary explanation for the rise of family income stagnation and income inequality over the past generation,” the Economic Policy Institute reports. “Additionally, progress in closing gender and racial wage gaps throughout this period has been either nonexistent (for racial gaps) or disappointingly slow (for gender gaps).”7
Women, Children, and Elders
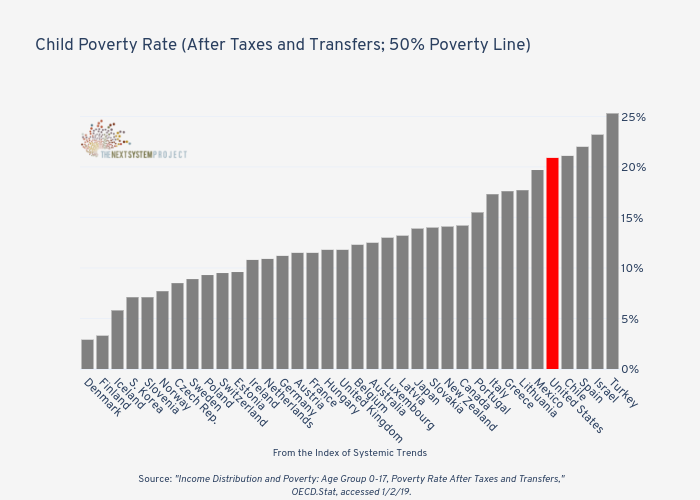
Children
Societies can, to a large degree, be judged by how they treat their most vulnerable populations; prime among them children and the elderly. When it comes to child poverty, many OECD countries have higher rates than for the general population. The United States is among these, with a child poverty rate of nearly 21% (compared to 17.8% for the whole population). However, this does not have to be the case; several OECD countries have lower child poverty rates than general rates. These include the Scandinavian countries of Denmark (2.9% vs. 5.5%), Finland (3.3% vs. 5.8%), Norway (7.7% vs. 8.2%), and Sweden (8.9% vs. 9.1%). The US’s high rates of child poverty, when compared with other developed nations, are a direct result of differences in attention and funding. According to the NGO Children International, “between 2012 and 2014, federal spending fell for kids’ education, nutrition, social services and early education and care. The government spends just 10% of the national budget on kids — a fraction of what other developed countries spend.”8
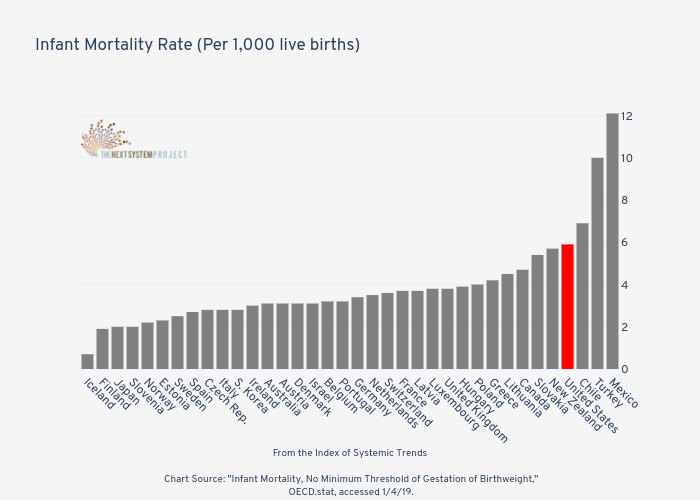
While improving in recent years, the United States still has one of the worst infant mortality rates of any advanced country—more than double many of its contemporaries in Europe and higher than countries such as Cuba (4.2 per thousand), Bosnia & Herzegovina (5), and Antigua & Barbuda (5). Moreover, infant mortality rates for Black people (10.9) in the United States is more than double that of White people (4.9), reflecting, in part, unequal access to quality medical care. Similarly, Blacks have significantly higher rates of neonatal mortality (deaths less than 28 days after birth) than Whites, and the US as a whole has more neonatal deaths than most other advanced countries.9
Elders
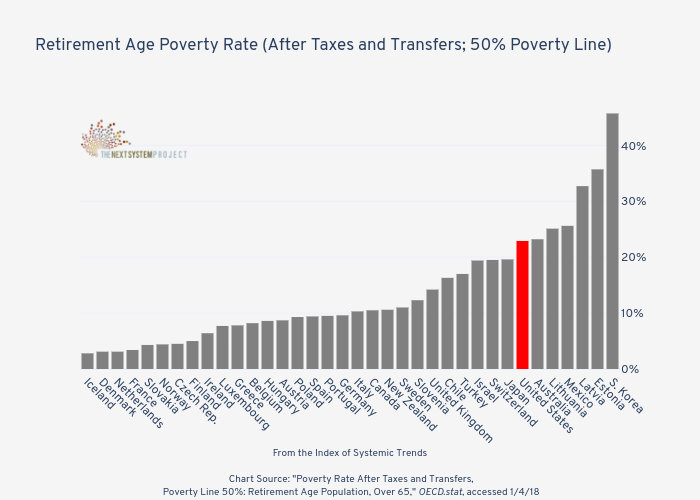
Along with children, the elderly are a particularly vulnerable segment of society. As with children, a higher percentage of elderly Americans live in poverty than does society as a whole. It has one of the highest rates of elderly poverty in the OECD, beating only South Korea (which is an outlier for cultural and longevity reasons), Mexico, Latvia, Estonia, and Australia. This is due, in part, to the relatively weak retirement system in the United States. While Social Security is a massively important government program (without it, reports estimate an additional 22.1 million Americans, most of them elderly, would live in poverty), it is demonstrably insufficient to keep older Americans out of poverty when compared with the retirement systems of other advanced countries. Due to the inadequacies of the retirement system, Americans retire at lower rates than their peers in other nations, remaining in the workforce longer. This has significant social consequences, blocking professional mobility for younger workers on the one hand, and forcing many older Americans into low-wage service work on the other.10
Women
Around 36% of all women in the United States have experienced physical or sexual violence from a partner in their lifetime. Out of the OECD countries, only Turkey and Mexico rank higher. By contrast, the United States’ immediate neighbor to the north, Canada, has the lowest rate at just 6%. Racial and economic inequality is connected to violence against women. According to the National Organization for Women “the poorer the household, the higher the rate of domestic violence—with women in the lowest income category experiencing more than six times the rate of nonfatal intimate partner violence as compared to women in the highest income category. When we consider race, we see that African-American women face higher rates of domestic violence than white women, and American-Indian women are victimized at a rate more than double that of women of other races.”11

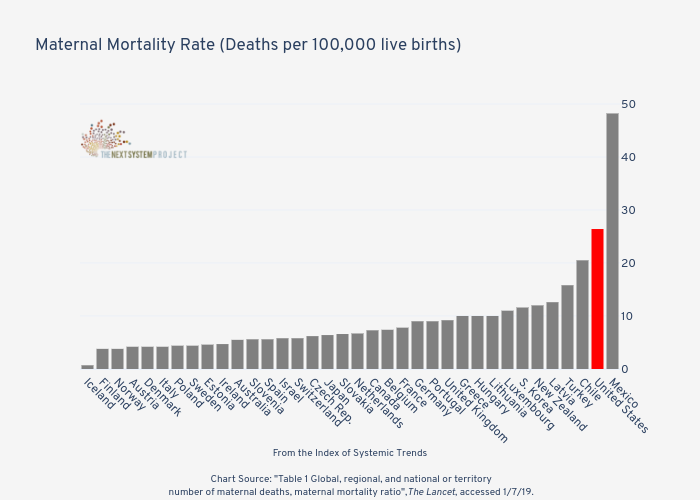
The United States also has one of the worst maternal mortality rates among advanced countries, with around 26 mothers dying during childbirth for every 100,000 live births. By contrast, this is roughly the same rate as Kazakhstan, Tajikistan, and Uzbekistan, countries that are significantly less developed than the U.S. Unlike infant mortality rates, which appear to be declining in the U.S. (although at slower rates than other countries), maternal mortality rates in the U.S. are actually rising. Furthermore, mortality is just the tip of the iceberg. According to reports, the number of women suffering serious complications during childbirth (such as blood transfusions, hysterectomies, and infections) more than doubled between 1993 and 2014. Lack of access to affordable healthcare, especially for the poor and those in rural areas, is a big factor driving these trends, as is the incredible rise in births by Cesarean section. U.S. C-Section rates have risen from less than 5% in the 1960s to around 33% today, a rate that is double that of many other advanced countries.12
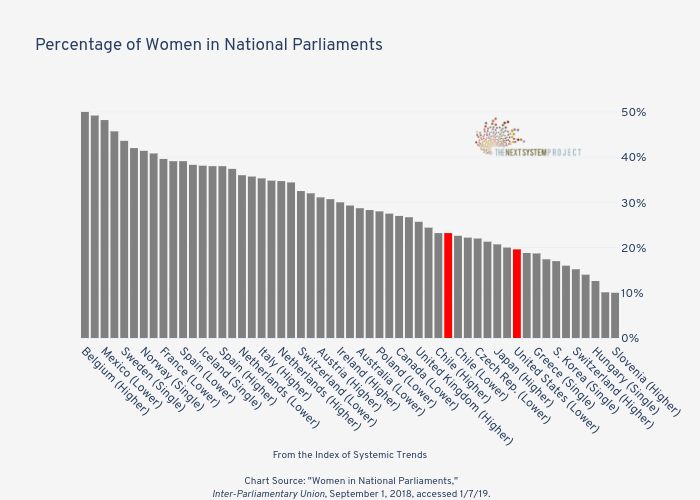
While the United States compares favorably with other advanced nations on several measures related to gender equality (and the gender pay gap has shrunk over the past several decades), it continues to lag behind when it comes to representation in high political office. The United States, famously, has yet to have a woman president or vice president and just four women have served on the Supreme Court in its entire history (out of 114 total judges). Data from the 115th Congress (prior to the 2018 midterm elections) showed that both the House of Representatives (19.6%) and the Senate (23.2%) ranked near the bottom among OECD countries when it came to female representation. By contrast, 48.2% of Mexico’s lower house and 49.2% of its upper house were women.13
Getting ahead or falling behind?
Cost of higher education
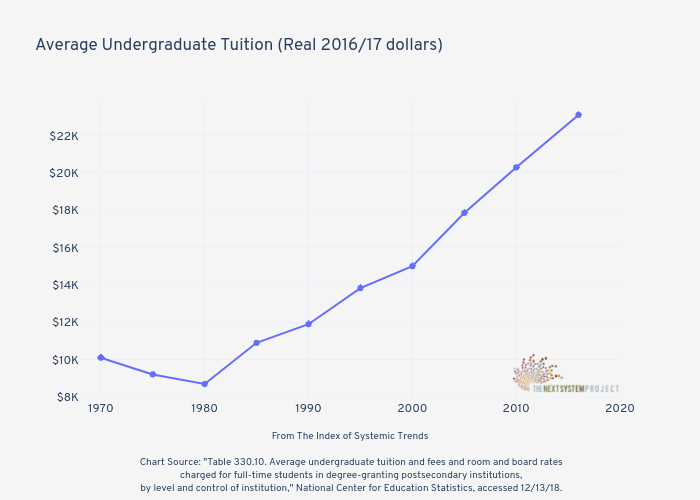
Traditionally, higher education has been an important factor in individual social mobility and economic advancement, as well as general societal prosperity and development. Yet for much of the country’s history, access to higher education was reserved for the wealthy. However, in the post-World War II period, the United States dramatically expanded access to higher education. Famously, the G.I. Bill allowed around 9 million veterans returning from the war to get a college education. Universities expanded, enrollment surged, state and local governments invested heavily in public institutions to expand access, and universities (supported by government research funding) made significant technological and scientific breakthroughs. For these reasons, the period from 1945-1970 is sometimes referred to as the “golden age” of higher education. A big factor in this increased accessibility was affordability. It was not uncommon in the 1960s for a person to be able to pay for their entire year’s tuition and fees with a part-time summer job, or for parents with a blue-collar job to be able to afford a child’s tuition by saving a few weeks of their salary. Since the 1970s, however, the average cost of undergraduate tuition has more than doubled when adjusted for inflation. This, combined with the wage stagnation experienced by many workers during the same period, has led to increasing levels of student loan debt, which in turn has further dampened economic prospects and social mobility. Between 2006 and 2018 alone, total student loan debt in the United States has risen from $480 billion to $1.5 trillion, with the average borrower now owing around $37,000 (compared to just $20,000 in 2005).14
Homeownership
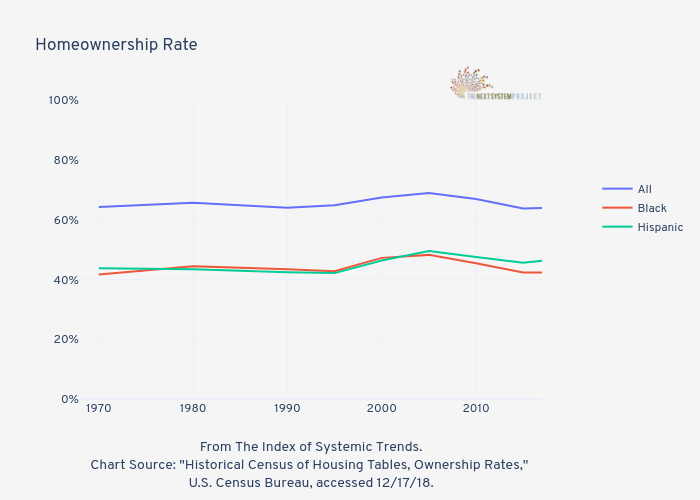
Homeownership has, traditionally, been the primary mechanism by which most Americans build and maintain wealth. For the vast majority of Americans (those in the middle 60 percent), their homes make up around 62% of their total assets. This reveals a paradox that is at the heart of the systemic failure to address intergenerational inequality (especially racial inequality) in the United States. In order to purchase a home, a person needs access to a certain amount of wealth (for a downpayment, taxes, fees, etc.), but for most American families access to such wealth is only available through ownership of a home. In 1968, President Johnson signed the Fair Housing Act into law, officially banning the practice of racial discrimination in the housing sector. It was widely assumed that this would narrow the homeownership gap between White people and families of color, providing additional opportunities for the latter to build wealth and access improved educational, health, and job opportunities. This did not come to pass. Since 1970, the homeownership rate (the percentage of households that are owner-occupied) for Black and Hispanic families has been virtually stagnant (and the gap between them and White families virtually the same)—with any gains almost entirely wiped out by the housing collapse and financial crisis of the late 2000s. Part of the problem, a 2017 report from the Institute of Policy Studies and Prosperity Now suggests, is that “for generations, White families have enjoyed access to wealth that has eluded their Black counterparts, making it far easier to come up with down payments and help their heirs claim their stake in the economy.”15
A fair share?
Corporate tax receipts
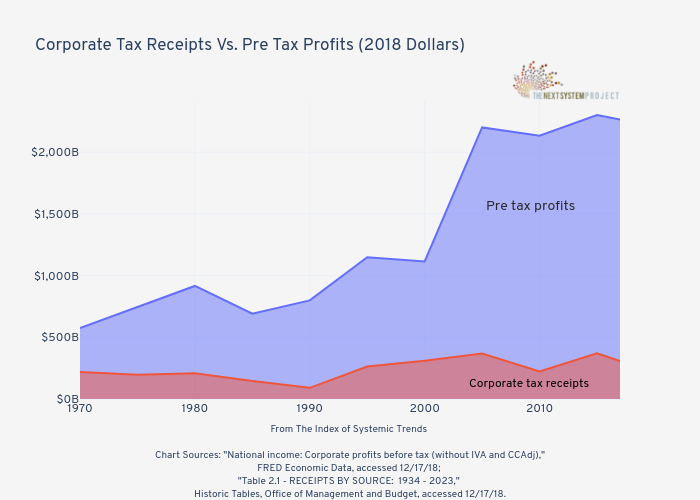
The mild welfare state (or social democratic state) put in place before, during, and after World War II was predicated on a simple premise: Corporations would be allowed to flourish and generate profits for their shareholders, and in exchange the state would tax and regulate them to help provide funding for national programs (including defense) and a bare-bones safety net (i.e. Medicare, Medicaid, Social Security, and Food Stamps) for the old, sick, and poor. During the post-war “boom” years, corporate taxation accounted for up to 30% of all federal tax revenue and during the Eisenhower administration, the top tax rate on corporations was 52%. Many CEOs accepted this arrangement and considered the payment of taxes as their national duty. However, starting in the early 1970s, this started to change. Spurred on by the infamous “Powell memorandum” and conservative think tanks, corporations began to agitate for lower tax rates and utilize loopholes and accounting tricks to hide their profits. This now includes the tactic of corporate inversions, where US companies merge with a foreign competitor and then move their headquarters overseas to avoid US taxes. Between 1970 and 2017, as corporate pre-tax profits exploded, federal tax revenue from corporations remained relatively constant. In turn, this lack of revenue allowed (and continues to allow) conservative politicians to demand cuts to social programs and the safety net.16
Top individual tax rate
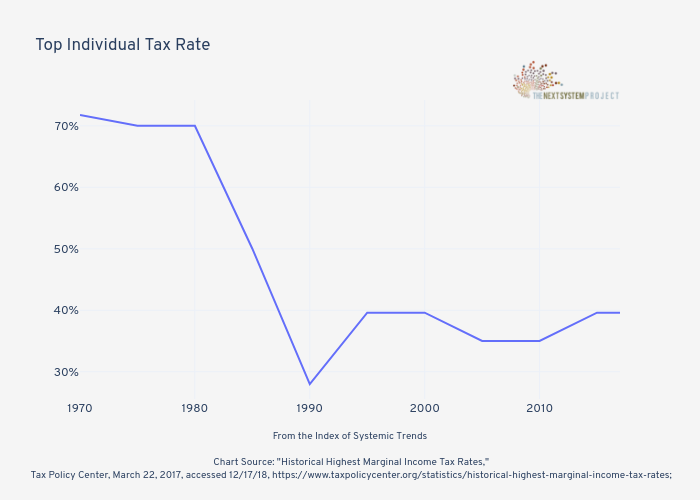
Another feature of the post-war economic settlement was high taxation rates on the top earners. This, as Piketty demonstrates, was critical to driving down income inequality during these years and limiting the hereditary accumulation of wealth. In the 1950s and early 1960s (during the Truman, Eisenhower, and Kennedy administrations), the top tax rate on individuals was as high as 92%, higher than it was during World War II. By 1969, it was still at 77%. Since then, however, it has fallen precipitously, with the biggest drops coming in the 1980s during the Reagan administration as part of the now thoroughly discredited program of “trickle-down economics,” which posited that by cutting taxes on the rich, their increased income would somehow work its way down to the middle and lower classes. However, as billionaire investor Warren Buffet recalls, “During this period, the tsunami of wealth didn’t trickle down. It surged upward.”17
Working
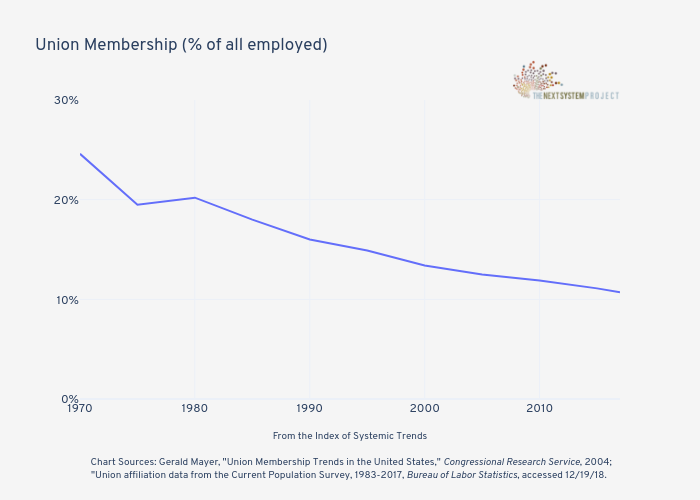
Union membership
A third feature of the post-war economic settlement was the role of labor unions as a “countervailing” force (to use John Kenneth Galbraith’s famous term) to the power of business generally, and large corporations in particular. Union membership surged during the New Deal and World War II as a result of intense organizing and supportive public policies. By 1954, union membership rates hit a high of around 34.7% (of nonagricultural workers). While the concept of an explicit or implicit agreement or accord between the labor movement and corporate America during the 1950s and 1960s is controversial among scholars, unions did not face the same level of repression as in the early part of the 20th century and in many industries became accepted parts of the economic landscape. These high (for the US) rates of unionization are associated with the decreased economic inequality of this period, as union jobs came with better pay, benefits, and working conditions. Unions also played a pivotal role in many of the progressive legislative successes of the period, including with regards to civil rights and the environment. Since the 1970s, however, attacks on labor unions by businesses and their allies in government have continued to increase. In 1981, Ronald Reagan broke a strike by the air traffic controllers union, ushering in what many observers have described as a new antagonistic era of labor-business-government relations in the United States. In recent years, attacks have escalated, especially at the state level and on public sector unions. By 2017, union membership had fallen to just 10.7%. Moreover, in the private sector, it is down to just 6.5%.18
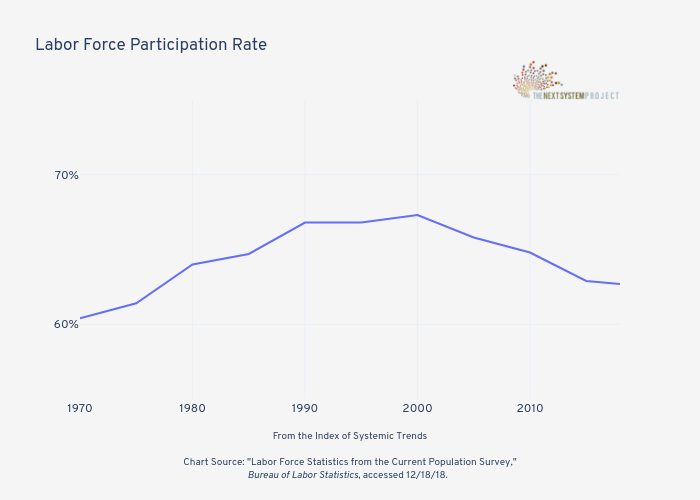
Labor force participation
In public discourse, the official unemployment rate (U-3) is usually the only indicator provided to measure the availability (or lack thereof) of jobs in the economy. Occasionally, observers will highlight the difference between this rate (which measures the total unemployed as a percent of the civilian labor force) and other measures such as the U-6 rate (which measures “Total unemployed, plus all persons marginally attached to the labor force, plus total employed part time for economic reasons, as a percent of the civilian labor force plus all persons marginally attached to the labor force”). While the U-6 rate gives a more nuanced picture (and is usually substantially higher than the U-3 rate), both these rates are largely cyclical (they rise and fall with the booms and busts endemic to capitalist economies). However, the labor force participation rate—which measures the number of people available to work compared with the total civilian noninstitutional population over the age of 16—is a more stable way to evaluate the long-term health of the labor market. The labor force participation rate rose throughout the second half of the 20th Century as more people (especially women) entered the labor force. However, the rate peaked in 2000 and has been falling ever since. The financial crisis of the late 2000s had a big impact, as many workers left the labor force for a variety of reasons. However, there are also structural reasons, including the general aging of the American population; long-term unemployed persons dropping out of the labor force permanently; an increasing opioid and drug dependency epidemic; and increased rates of ill health. It is possible that continued low rates of labor participation are one reason why wage growth has been surprisingly slow in recent years despite record low levels of official unemployment. In other words, the official unemployment rate may be masking long-term, systemic weakness in the labor market.19
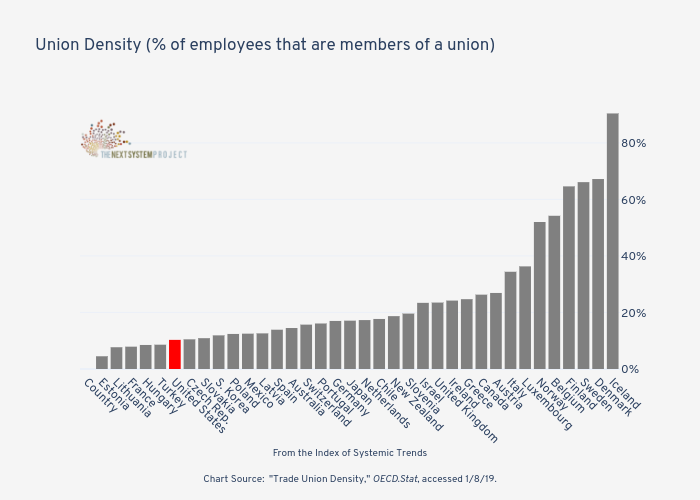
Unions by country
Strong trade unions are closely associated with reduced economic inequality. According to one recent study from Princeton University researchers, “unions consistently have provided workers with a 10%-to-20% wage boost over their non-union counterparts over the past eight decades,” and “when unions have expanded, whether at the national or state level, they tended to draw in more unskilled workers and raise their relative wages, with significant impacts on inequality.” While union membership is declining across the advanced world, the United States continues to have lower rates than many of its contemporaries. This is due in part to a relatively low high-water mark (around 34.7% in the 1950s) when compared to other countries, and the intensity of the ideological attack on unions since the 1970s in the United States. With France being an outlier (due to an arrangement whereby unions bargain sectorally and represent workers on company boards, resulting in strong unions and more than 90% of workers covered by collective bargaining agreements), the United States’s main company amongst OECD countries are several former Soviet satellite states that did not have a history of strong, independent unions (Estonia, Lithuania, Hungary, Czech Republic, and Slovakia) as well as Turkey.20
Health and wellbeing
Healthcare
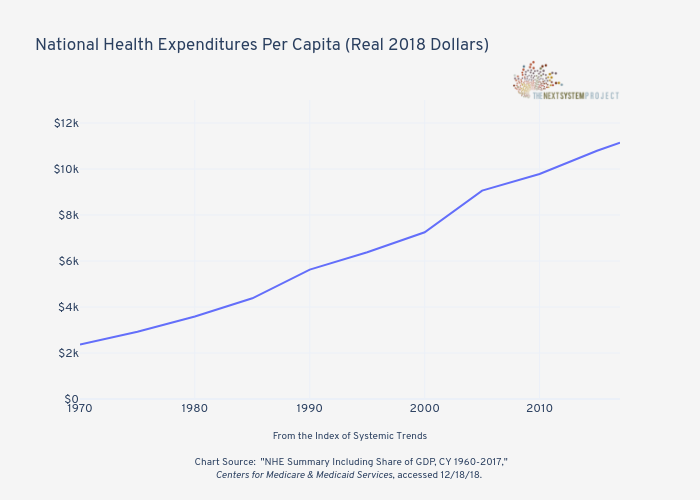
Healthcare costs
The American healthcare system, with its mix of for-profit, nonprofit, and public insurance companies and medical providers, is one of the most expensive in the world, yet (as will be seen in the next section) delivers generally poor outcomes when compared with other countries. In recent years, healthcare, and specifically, the rising cost of healthcare, has become a major political issue. Yet, despite concerted attention from both political parties, including the enactment during the Obama administration of the “Affordable Care Act” and subsequent efforts by Republicans to roll it back, healthcare costs continue to rise. In 1970, national healthcare expenditures per capita amounted to $2,367 (in 2018 dollars). By 2017, this was up to $11,145. The rising cost of healthcare has led to tens of thousands of bankruptcies as the result of medical debt, countless millions of severe illnesses and premature deaths, and the evisceration of savings and retirement income for many Americans. It is now not uncommon for individuals with life-threatening illnesses or costly surgeries (or even, in some cases, minor procedures) to rely on charitable donations through crowdfunding websites (such as GoFundMe) in order to pay for hospital stays.21
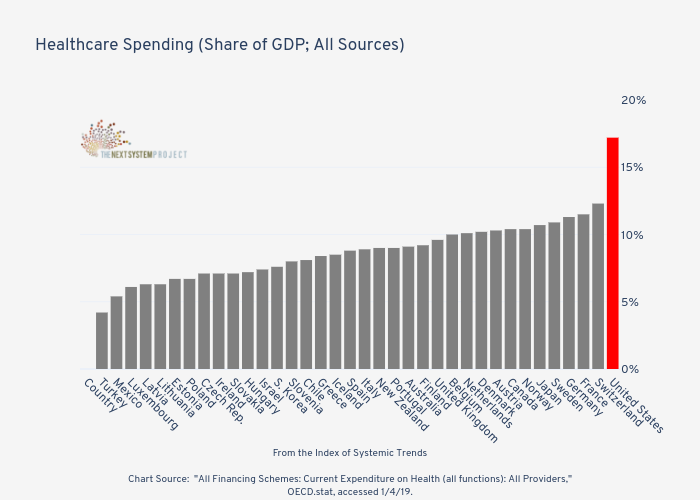
Healthcare costs by country
The US healthcare system is by far and away the most expensive of any country in the OECD, approaching 20% of the nation’s GDP. It is sometimes suggested that the reason for the incredible disparity between the US and other countries is better and more accessible healthcare. However, new research suggests this is not the case. Rather, it is a stark difference in prices driven, at least in part, by the for-profit nature of many parts of the system. “Prices are where we are truly exceptional. We’re just higher for everything—drug prices, physician prices, nursing prices, hospital prices, MRI prices,” writes Dr. Ashish Jha of the Harvard T.H. Chan School of Public Health. This includes higher costs for pharmaceuticals, higher costs for operations, higher costs for tests, and significantly higher costs for doctor incomes.22
Life expectancy
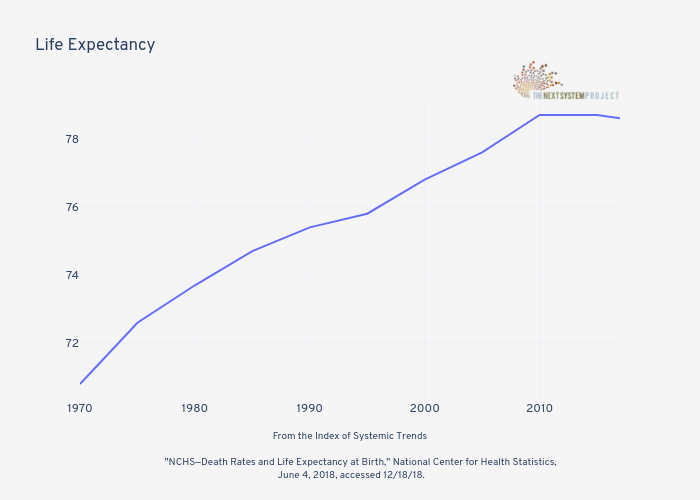
Life expectancy
Although lagging other developed countries, life expectancy in the United States rose steadily throughout the second half of the 20th century. However, much to the surprise of experts, life expectancy in the United States has now dropped twice in the past three years, a trend unseen since the great influenza pandemic in the aftermath of World War I. The drop is partly attributable to the opioid epidemic and rising suicide rates, and it is unclear whether or not this is a temporary blip on an otherwise upward trajectory or an inflection point before a sustained fall. Either way, research suggests long-term negative trends when it comes to worsening health inequality: For men born in 1920, the lowest 10 percent of wage earners could expect to live 72.9 years; the top 10 percent of earners could expect to live 79.1 years (a difference of 6.2 years). For men born in 1950, the bottom 10 percent of wage earners could expect to live 73.6 years and the top 10 percent 87.2 years (a difference of 13.6 years). For women, the gap grew from 4.7 years to 13 years.23
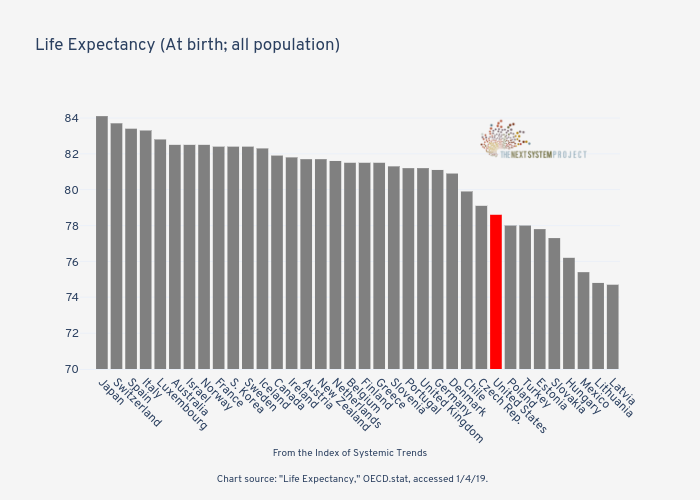
Life expectancy by country
Despite the extraordinarily high cost of healthcare in the United States, the system delivers comparatively poor outcomes across a variety of indicators. First and foremost, the United States has the lowest life expectancy of any of the high-income OECD countries (and is bested by numerous lower income countries as well). While evidence suggests that the healthcare system is reasonably good at treating diseases, it may be falling short of its peers on preventing disease. Moreover, as the United Health Foundation points out, the life expectancy measurement is “highly influenced by infant mortality,” which is another area of health where the United States fares poorly with its counterparts around the world.24
Climate change
Climate change
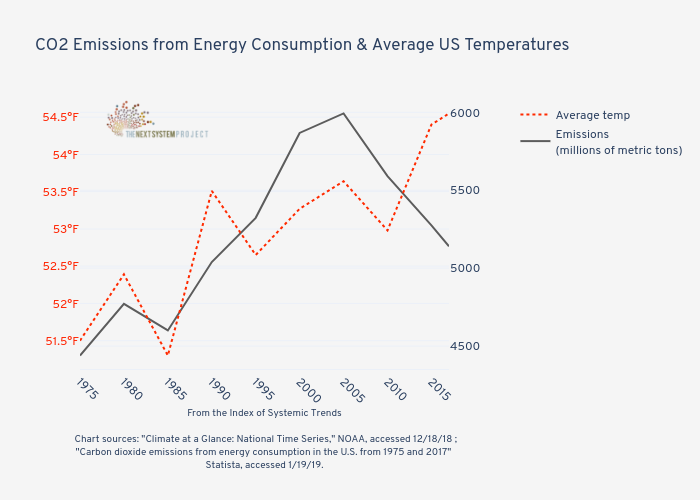
Climate change is undoubtedly a global challenge. However, the United States plays a central role for numerous reasons. It is home to many of the fossil fuel corporations responsible for both significant carbon dioxide emissions and for blocking or stalling national and global efforts to address climate change. For decades (until 2005) it was the top global emitter of CO2, and it has often been reluctant to join international efforts to address climate change. While CO2 emissions around the world continue to rise, in the United States they have leveled off and begun to fall as a result of the transition towards both natural gas and renewable energy (along with more fuel-efficient cars and energy conservation efforts). However, the Energy Information Agency predicted that in 2018 CO2 emissions would rise slightly and then remain flat in 2019. At the same time, the historical legacy of US emissions (and the continued rise in emissions worldwide) has led to steadily increasing average temperatures in the United States. According to the EPA in 2016, “average temperatures have risen more quickly since the late 1970s (0.29 to 0.46°F per decade since 1979). Eight of the top 10 warmest years on record for the contiguous 48 states have occurred since 1998.” 25
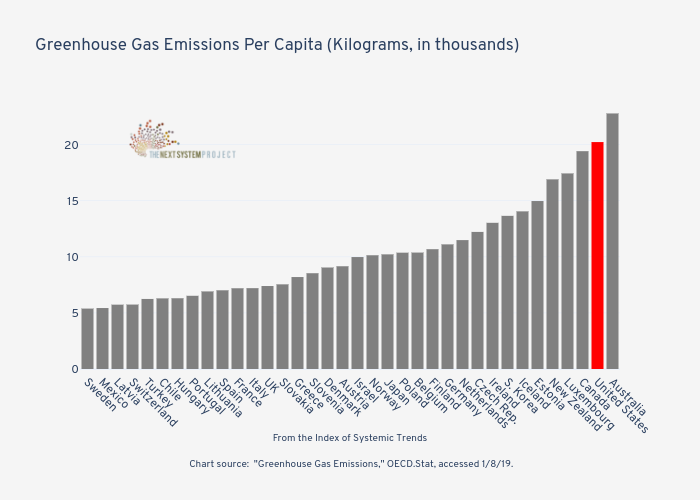
Greenhouse gas emissions
Climate change is the most existential threat global human civilization as we know it has ever faced. Without rapid action, future generations will inhabit a planet that is far different and far less hospitable that we do. Despite recent reductions, the United States remains one of the world’s top contributors of the greenhouse gasses that are altering the planet’s climate and threatening the lives and livelihoods of tens of millions of people around the world. When measured on a per capita basis, the United States is the second highest greenhouse gas emitter in the OECD behind Australia. Under the presidency of Donald Trump, the United States has pulled out of the Paris Climate Accords, joining only Syria and Nicaragua on the sidelines of the international effort to head off the disastrous consequences of climate change by reducing greenhouse gas emissions.26
Crime, punishment, and state violence
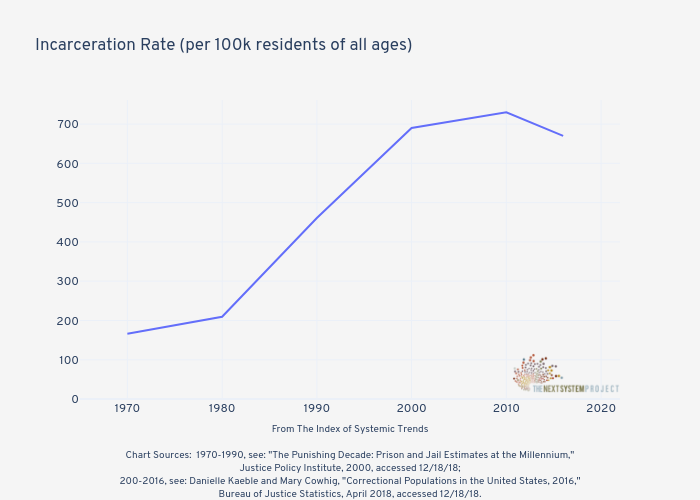
Mass incarceration
For much of the 20th century, the US incarceration rate (the number of people imprisoned per 100,000 residents of all ages) remained relatively constant (in the 120-200 range). However, beginning in the 1970s incarceration rates began to skyrocket. This was due to a number of policy decisions, including the ramping up of the drug war (and increasing prison time for drug offenders), “three strikes” laws (long prison sentences for repeat offenders), and “truth in sentencing” laws (reductions in early release). These laws continued to be enacted, and the prison population continued to rise, despite reductions in crime rates. “Over the four decades when incarceration rates steadily rose, U.S. crime rates showed no clear trend: the rate of violent crime rose, then fell, rose again, then declined sharply,” a 2014 National Research Council Report found. “The best single proximate explanation of the rise in incarceration is not rising crime rates, but the policy choices made by legislators to greatly increase the use of imprisonment as a response to crime.” For many observers, the policies enabling mass incarceration were economically motivated and had clear racist intentions. “When African-Americans said we refuse to work as, basically, semi-slave laborers with no voting rights and no protections, and my generation said ‘we’re not gonna do that work our parents did,’ then employers started bringing undocumented immigrants into the country to work with no rights and no protections, and when the Government said ‘well, what are we gonna do with all these young folks like me who don’t wanna do this kind of semi-slave work?’—they didn’t reform the economy, they said ‘let’s lock’em up,’ and we got mass incarceration,” J. Phillip Thompson III states. Today the incarceration rate for Black and Hispanic prisoners in state and federal jails (excluding local) is 1,609 and 857 per 100,000 adult residents. For Whites it is just 274. In recent years, the total incarceration rate has begun to slowly decline. While this is positive, there is a long way to go to return to historical levels and, as will be shown in the next section, the United States continues to have one of the highest incarceration rates in the world.27
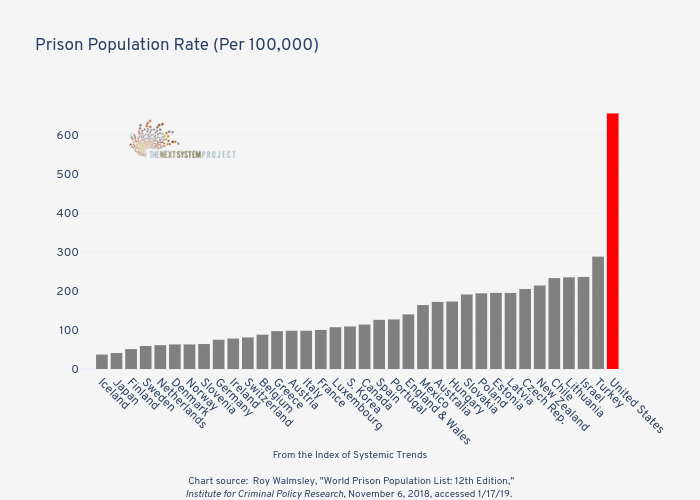
Prison population
One of the most astonishing international comparisons is the prison population rate (the number of prisoners per 100,000 people). Simply put, the United States has the highest prison population rate in the entire world (not just among other advanced countries or the OECD). The current rate (655) is 51 points higher than the nearest rival (El Salvador, with 604) and nearly 100 points higher than the third worst country (Turkmenistan, with 552). As described in the preceding section, this incredibly high rate is driven by a racialized incarceration system that imposes long sentences for relatively minor crimes (mandatory minimums) and repeat offenders. Moreover, unlike prison systems in many other advanced countries, the US system is severely lacking in programs and policies designed to rehabilitate prisoners (such as education and drug and alcohol treatment programs. Moreover, it is incredibly difficult for prisoners, once released, to obtain employment, housing, or social services. As a result, it is estimated that around 75% of released prisoners are reincarcerated within five years. This system of mass incarceration results in tremendous social and economic costs as entire communities are often caught up in a multigenerational cycle of family separation, crime, trauma, and imprisonment.28
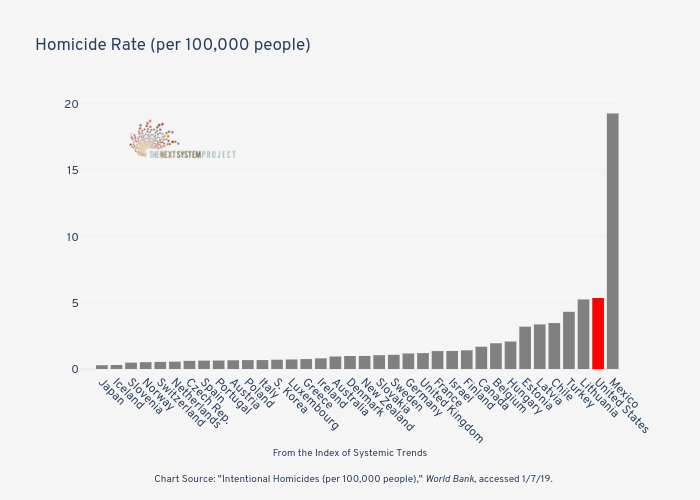
Homicide by country
A recent study by the World Health Organization and Imperial College London found that the when it comes to life expectancy “the poor recent and projected U.S. performance is at least partly due to high and inequitable mortality from chronic diseases and violence, and insufficient and inequitable health care.” When it comes to violent deaths, another study from the National Research Council and the Institute of Medicine found that the United States is in a league of its own when compared to 16 other advanced nations. One component of the violent-deaths measure is intentional homicide. In 2017, the FBI reported that there were approximately 17,284 murders in the United States, a 17.3% increase since 2013. With the exception of Mexico, which is gripped by a drug war (fueled by US demand), the United States has the highest homicide rate of any OECD country (5 times higher than some European countries).29
Weapons exports
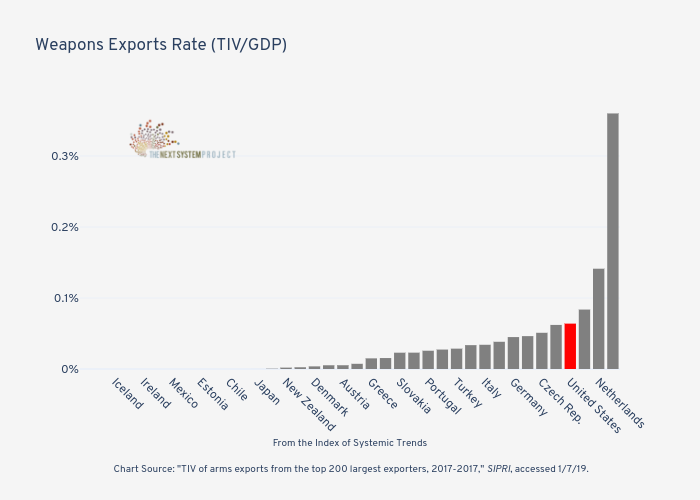
The United States also plays a leading role in exporting violence around the world. Between the end of World War II and the end of the 20th century, the U.S. “intervened” covertly or overtly in dozens of countries (and often the same country multiple times). These include (but are not limited to): Iran, China, Greece, Korea, Vietnam, Guatemala, Lebanon, Panama, Haiti, Congo, Cuba, Laos, Ecuador, Dominican Republic, Cambodia, Chile, El Salvador, Nicaragua, Grenada, Honduras, Libya, Iraq, Somalia, Bosnia, Serbia, Sudan, and Afghanistan. The new century has seen the longest war in American history (Afghanistan), the disastrous invasion of Iraq, interventions in Libya and Syria, extensive drone strikes in Pakistan and Yemen, and many more. Current estimates suggest that the US now has around 800 military bases and facilities in 70 foreign countries and facilities. Famously, the United States spends more on its military than do the next seven countries put together (China, Russia, Saudi Arabia, India, France, UK, and Japan). The United States is also one of the world’s leading weapons exporters, helping to fuel conflicts (such as the Saudi-led assault on Yemen), sustain illegal occupations (such as Israel’s control of the occupied Palestinian territories), and bolster repressive governments (such as Egypt’s military dictatorship) around the world. In pure dollar terms, the US now accounts for around 34% of all international arms sales, substantially higher than the next country on the list (Russia). When measured as a rate (TIV value of the weapons over GDP), the United States ranks fourth highest in the OECD behind only Israel, the Netherlands, and France.30
Is this what democracy looks like?
Institutional legitimacy
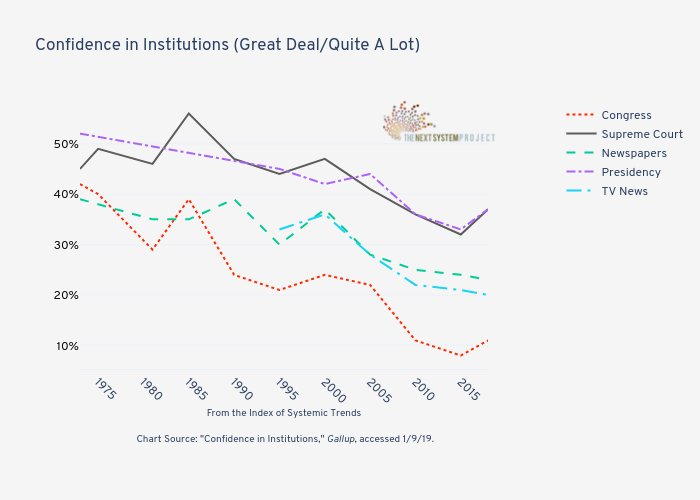
Since the early 1970s, there has been a slow but steady erosion of public confidence in some of the key institutions of the United States’ democratic system. This is most clear when in comes to confidence in Congress, which has fallen from the low-40% range to around 10%, but also includes the Supreme Court, the presidency, and the media. Commentators are divided as to the causes for this decline, but the ideological war waged by neoliberals on the role of government (embodied in the famous Ronald Reagan phrase that “government is not the solution…government is the problem”) starting in the 1970s has surely played a role. This has been amplified during the presidency of Donald Trump with relentless attacks on the news media and other institutions.31
Economic democracy
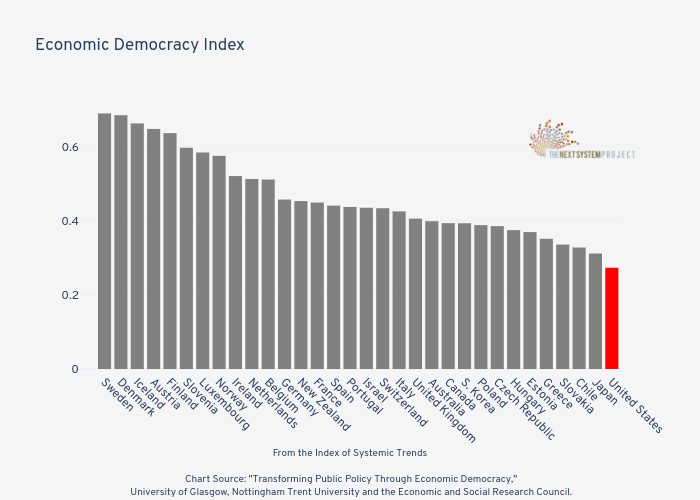
Faced with the re-emergence of fascism and hard-right nationalism around the world, many of the defenders of the established order have soured on democracy in favor of rule by an international technocratic elite. However, right-wing extremism masquerading as populism simply cannot be defeated in this way. Instead, the answer must include a process of genuine and increased democratic engagement and participation, especially in the economic sphere. In a groundbreaking recent study, researchers affiliated with the University of Glasgow, Nottingham Trent University and the Economic and Social Research Council constructed an “Index of Economic Democracy” (which includes workplace and individual rights, distribution of economic decision-making, transparency, and associational economic democracy) and found a statistically significant relationship between levels of economic democracy and both inequality and labor productivity. When measured against other OECD countries, the United States finished dead last in both the raw and weighted Index of Economic Democracy.32
- 1“Historical Poverty Tables: People and Families - 1959 to 2017, Table 2,” Census Bureau, accessed 12/12/18.
- 2Rebecca M. Blank, “Why the United States Needs and Improved Measure of Poverty,” Brookings, July 17, 2008, accessed ½/19, https://www.brookings.edu/testimonies/why-the-united-states-needs-an-improved-measure-of-poverty/.
- 3Thomas Piketty, Capital in the Twenty-First Century (Cambridge, MA: Harvard University Press, 2014).
- 4Dedrick Asante-Muhammad, et at., The Road to Zero Wealth: How the Racial Wealth Divide is Hollowing Out America’s Middle Class (Washington, D.C.: IPS and Prosperity Now, 2017).
- 5Thomas Piketty, Capital in the Twenty-First Century (Cambridge, MA: Harvard University Press, 2014), 23.
- 6Thomas Piketty, Capital in the Twenty-First Century (Cambridge, MA: Harvard University Press, 2014), 292.
- 7Lawrence Mishel, “Causes of Wage Stagnation,” EPI, January 6, 2015, accessed 12/12/18, https://www.epi.org/publication/causes-of-wage-stagnation/.
- 8“Child Poverty in the U.S.,” Children International, accessed ½/19, https://www.children.org/global-poverty/global-poverty-facts/facts-about-poverty-in-usa.
- 9“Mortality Rate, Infant (Per 1,000 Live Births),” World Bank, accessed 1/14/19; Bradley Sawyer and Selena Gonzalez, “How Does Infant Mortality in the U.S. Compare to Other Countries?” Peterson-Kaiser Health System Tracker, July 7, 2017, accessed 1/7/19, https://www.healthsystemtracker.org/chart-collection/infant-mortality-u-s-compare-countries/#item-start.
- 10Kathleen Romig, “Social Security Lifts More Americans Above Poverty Than Any Other Program,” CBPP, November 5, 2018, accessed ¼/19, https://www.cbpp.org/research/social-security/social-security-lifts-more-americans-above-poverty-than-any-other-program; Teresa Ghilarducci, “America’s Unusual High Rates of Old-Age Poverty and Old-Age Work,” Forbes, March 2, 2018, accessed ¼/19, https://www.forbes.com/sites/teresaghilarducci/2018/03/02/americas-unusual-high-rates-of-old-age-poverty-and-old-age-work/#29ed8729458a.
- 11“Violence Against Women in the United States: Statistics,” NOW, accessed 1/7/19, https://now.org/resource/violence-against-women-in-the-united-states-statistic/.
- 12Michael Ollove, “A shocking number of U.S. women still die of childbirth. California is doing something about that,” The Washington Post, November 4, 2018, accessed 1/7/19; Katherine Ellison and Nina Martin, “Nearly Dying In Childbirth: Why Preventable Complications Are Growing In U.S.,” NPR, December 22, 2017, accessed 1/7/19.
- 13“Women in National Parliaments,” Inter-Parliamentary Union, September 1, 2018, accessed 1/7/19, http://archive.ipu.org/wmn-e/arc/classif010918.htm.
- 14“Press Briefing: Household Borrowing, Student Debt Trends and Homeownership,” Federal Reserve Bank of New York, April 3, 2017, accessed 12/13/18; “Student Loans Owned and Securitized, Outstanding,” Federal Reserve Bank of St. Louis, accessed 12/13/18.
- 15“Current Population Survey/Housing Vacancy Survey,” U.S. Census Bureau, February 27, 2018; Dedrick Asante-Muhammad, et at., The Road to Zero Wealth: How the Racial Wealth Divide is Hollowing Out America’s Middle Class (Washington, D.C.: IPS and Prosperity Now, 2017); Edward N. Wolff, “Household Wealth Trends in the United States, 1962 to 2016: Has Middle Class Wealth Recovered?” NBER Working Paper No. 24085, November 29, 2017.
- 16Thomas L. Hungerford, “Corporate Tax Rates and Economic Growth Since 1947,” EPI, June 4, 2013, accessed 12/17/18, https://www.epi.org/publication/ib364-corporate-tax-rates-and-economic-growth/.
- 17Catherine Clifford, “Warren Buffett on the US economy: ‘The tsunami of wealth didn’t trickle down. It surged upward’,” CNBC, January 4, 2018, accessed 12/17/18, https://www.cnbc.com/2018/01/04/warren-buffett-on-the-failure-of-trickle-down-economics.html.
- 18Gerald Mayer, “Union Membership Trends in the United States,” Congressional Research Service, 2004, https://digitalcommons.ilr.cornell.edu/cgi/viewcontent.cgi?article=1176&context=key_workplace; “Union affiliation data from the Current Population Survey, 1983-2017, Bureau of Labor Statistics, accessed 12/19/18.
- 19“Table A-15. Alternative measures of labor underutilization,” Bureau of Labor Statistics, accessed 12/18/18; Kimberely Amadeo, “Labor Force Participation Rate and Why It Hasn’t Improved,” The Balance, December 10, 2018, accessed 12/18/18, https://www.thebalance.com/labor-force-participation-rate-formula-and-examples-3305805.
- 20Denise Valenti, “Princeton economists find that unions had historical role in helping address income inequality,” Princeton University, June 21, 2018, accessed 1/8/19, https://www.princeton.edu/news/2018/06/21/princeton-economists-find-unions-had-historical-role-helping-address-income; Dylan Matthews, “Europe could have the secret to saving America’s unions,” Vox, April 17, 2017, accessed 1/8/19, https://www.vox.com/policy-and-politics/2017/4/17/15290674/union-labor-movement-europe-bargaining-fight-15-ghent.
- 21”NHE Summary Including Share of GDP, CY 1960-2017,” Centers for Medicare & Medicaid Services, accessed 12/18/18, https://www.cms.gov/Research-Statistics-Data-and-Systems/Statistics-Trends-and-Reports/NationalHealthExpendData/NationalHealthAccountsHistorical.html.
- 22Richard Knox, “Why Are U.S. Health Costs The World’s Highest? Study Affirms ‘It’s The Prices, Stupid’,” WBUR, March 13, 2018, accessed ¼/18, https://www.wbur.org/commonhealth/2018/03/13/us-health-costs-high-jha.
- 23Sabrina Tavernise, “Disparity in Life Spans of the Rich and the Poor Is Growing,” New York Times, February 12, 2016, accessed 12/18/18, https://www.nytimes.com/2016/02/13/health/disparity-in-life-spans-of-the-rich-and-the-poor-is-growing.html.
- 24Samuel H. Preston and Jessica Y. Ho, “Low Life Expectancy in the United States: Is the Health Care System at Fault?” NBER Working Paper No. 15213, August 2009; “2016 Annual Report: Comparison with Other Nations,” America’s Health Rankings, accessed ¼/19, https://www.americashealthrankings.org/learn/reports/2016-annual-report/comparison-with-other-nations.
- 25“Climate Change Indicators: U.S. and Global Temperature,” EPA, August 2016, accessed 12/18/18, https://www.epa.gov/climate-indicators/climate-change-indicators-us-and-global-temperature; “U.S. energy-related CO2 emissions expected to rise slightly in 2018, remain flat in 2019,” EIA, February 8, 2018, accessed 12/18/18, https://www.eia.gov/todayinenergy/detail.php?id=34872; Justin Gillis and Nadja Popovich, “The U.S. Is the Biggest Carbon Polluter in History. It Just Walked Away From the Paris Climate Deal,” New York Times, June 1, 2017, accessed 12/18/18, https://www.nytimes.com/interactive/2017/06/01/climate/us-biggest-carbon-polluter-in-history-will-it-walk-away-from-the-paris-climate-deal.html.
- 26Maya Wei-Haas, “How America Stacks Up When It Comes to Greenhouse Gas Emissions,” Smithsonian, June 2, 2017, accessed 1/8/19, https://www.smithsonianmag.com/smart-news/how-America-stacks-up-greenhouse-gas-emissions-180963560/.
- 27E. Ann Carson, “Prisoners in 2016,” Bureau of Justice Statistics, August 7, 2018, accessed 12/18/18, https://www.bjs.gov/content/pub/pdf/p16.pdf; J. Phillip Thompson III, “Phil Thompson on the Historical Fight for Civil and Economic Rights,” The Next System Project, September 18, 2015, accessed 12/18/28, https://thenextsystem.org/phil-thompson-on-the-historical-fight-for-civil-and-economic-rights; Jeremy Travis, et al., eds., The Growth of Incarceration in the United States: Exploring Causes and Consequences (Washington, D.C.: The National Academies Press, 2014).
- 28The Economic Impact of Prison Rehabilitation Programs,” Penn Wharton PPI, August 17, 2017, accessed 1/7/19, https://publicpolicy.wharton.upenn.edu/live/news/2059-the-economic-impact-of-prison-rehabilitation/for-students/blog/news.php.
- 29“2017 Crime in the United States: Murder,” FBI, accessed 1/7/19, https://ucr.fbi.gov/crime-in-the-u.s/2017/crime-in-the-u.s.-2017/topic-pages/murder; Sam Meredith, “US life expectancy is low and is now projected to be on par with Mexico by 2030,” CNBC, February 22, 2017, accessed 1/17/19, https://www.cnbc.com/2017/02/22/us-life-expectancy-is-low-and-is-now-projected-to-be-on-par-with-mexico-by-2030.html; Michelle Castillo, “Report: U.S. life expectancy lowest among wealthy nations due to disease, violence,” CBS News, January 10, 2013, accessed 1/7/19, https://www.cbsnews.com/news/report-us-life-expectancy-lowest-among-wealthy-nations-due-to-disease-violence/.
- 30”US Interventions,” Global Policy Forum, December 2005, accessed 1/7/19, https://www.globalpolicy.org/us-military-expansion-and-intervention/26024-us-interventions.html; Tim Bowler, “Which country dominates the global arms trade?” BBC News, May 10, 2018, accessed 1/7/19, https://www.bbc.com/news/business-43873518; David Vine, “Where in the World is the U.S. Military?” Politico, July/August 2015, accessed 1/7/19, https://www.politico.com/magazine/story/2015/06/us-military-bases-around-the-world-119321; “U.S. Defense Spending Compared to Other Countries,” Peter G. Peterson Foundation, May 7, 2018. accessed 1/7/19, https://www.pgpf.org/chart-archive/0053_defense-comparison.
- 31“Confidence in Institutions,” Gallup, accessed 1/9/19, https://news.gallup.com/poll/1597/confidence-institutions.aspx.
- 32“Transforming Public Policy Through Economic Democracy,” University of Glasgow, Nottingham Trent University and the Economic and Social Research Council, https://democratisingtheeconnomy.wordpress.com/.


